Average reaction time starts with a specific task.
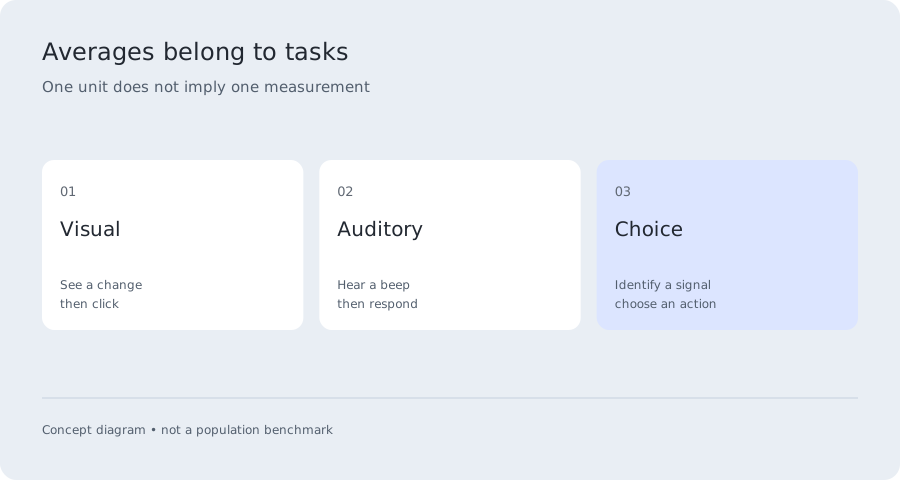
Average reaction time describes a group or a set of responses under particular conditions. It is not one fixed human constant. The signal might be a light, a sound or one of several shapes. The required response might be a click, a selected key or the beginning of a reaching movement. Changing any of those details changes the question being measured.
For a concrete adult visual reference, Woods et al. reported a mean of 231 ms in Experiment 1, involving 1,469 adults aged 18–65. Their calibrated result was 213 ms. These values describe their apparatus and protocol, not a universal threshold for this website. Our browser test reports its raw observed interval without borrowing a laboratory correction.
Use this page as a reference selector. If you want to understand your own number, open the score interpreter. If you want to compare ages, inspect the actual dataset and its limits. If you measured sound or a choice, stay within that task family. An average reaction time is useful only after you know what has been averaged.
Calculating average reaction time: mean, median and best.
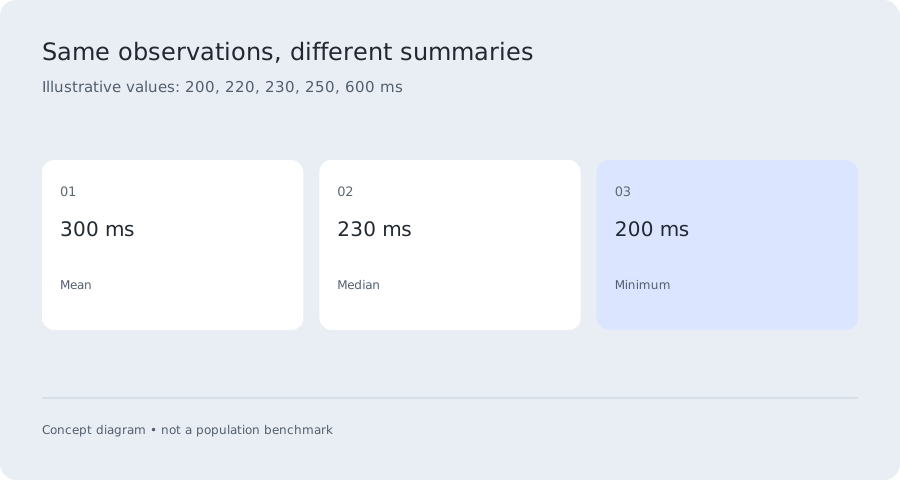
The arithmetic mean adds all included response times and divides by their count. The median sorts them and finds the middle. The minimum is the fastest included attempt. Although people often use “average” casually for a typical value, a comparison should state exactly which statistic is being used.
Imagine five valid responses of 200, 220, 230, 250 and 600 ms. Their mean is 300 ms, their median is 230 ms and their best is 200 ms. These illustrative numbers come from no participant dataset. They show why an occasional long response can move the average reaction time while leaving the middle value much less affected.
Exclusions matter too. A study may remove anticipations, errors or lapses using a predefined rule. Our visual test excludes early inputs, timeouts and interrupted rounds from the timing average and retains their status in the export. A valid slow response remains included. A comparison that silently removes slow values after seeing them can be misleading.
Read an average reaction time benchmark carefully.
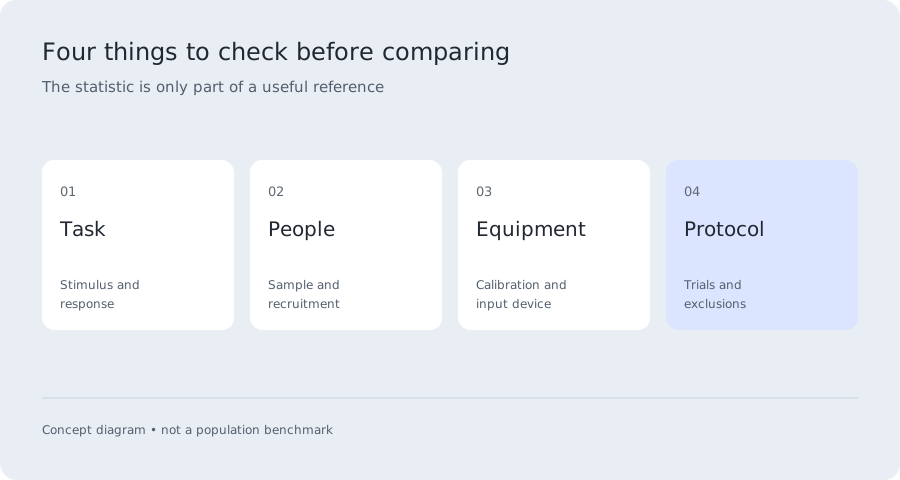
Before using an average reaction time, look for five things: the task, the people, the apparatus, the number of trials and the statistic. A study of adults cannot automatically describe schoolchildren. A sample of people who voluntarily take online tests may differ from the wider population. A very large sample does not remove those differences.
Check the starting and ending events as well. Some tasks measure the onset of a movement, while others measure an eventual button response. In a game, a total action time may include finding a target and moving the pointer. In driving, recognizing a hazard and applying a brake involve different stages from a prepared finger click.
The original source should allow you to trace a number back to a named experiment or table. A general link to a research institution is not enough to explain an exact age row or professional-player benchmark. The linked guides preserve what we could verify and explicitly identify missing information rather than filling gaps with confident-looking values.
Why browser scores and laboratory values differ.
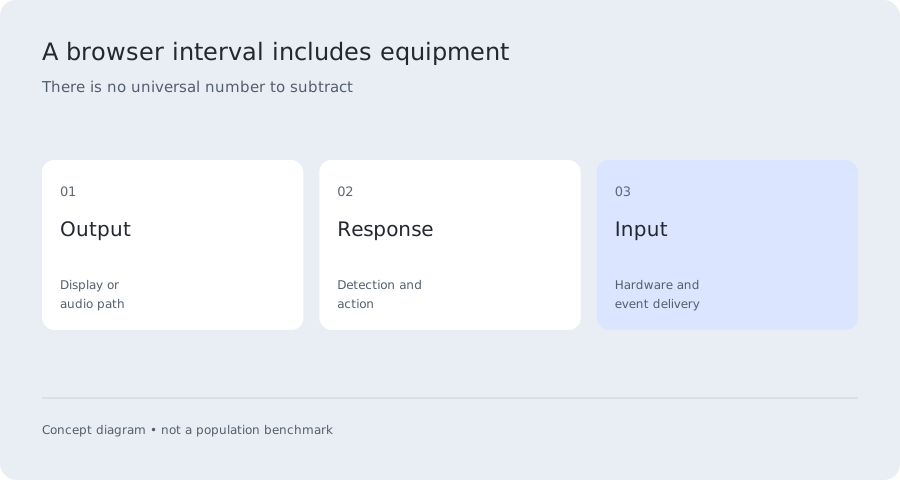
A browser observes software events, not every physical stage of a response. A requested frame still has to reach a display, and a press still has to travel through input hardware and the operating system. Audio has an output path of its own. A timer can use milliseconds while still having uncertainty about the physical signal onset.
That does not make a browser tool useless. It makes consistent measurement conditions important. A personal average reaction time measured on the same device and input method is easier to compare over repeated sessions. Changing both the task and equipment makes it difficult to attribute a difference to the person.
You cannot correct an unfamiliar device by subtracting a fixed delay copied from a paper. Calibration measures a specific setup. We expose the timer limitations and retain raw attempts so that you can see what was recorded. We do not claim that display refresh rate, network speed or one hardware specification completely explains every difference.
Record your own average reaction time baseline.
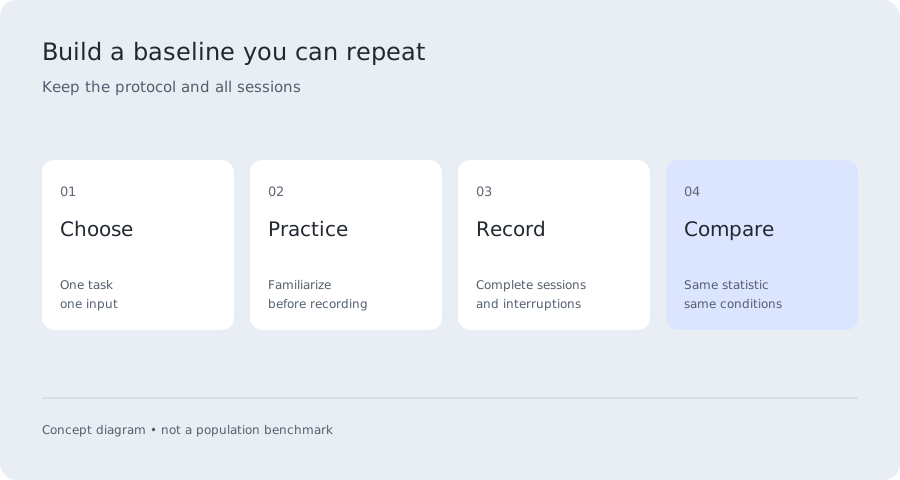
Choose one task and input method. Do a familiarization session, then keep several complete sessions instead of selecting one personal best. Record the date and any interruptions. Compare the median, average reaction time and spread together; a lower average accompanied by many early attempts may reflect a different strategy rather than a clean improvement.
If you are planning an experiment, decide the comparison and exclusion rules before measuring. Change one ordinary condition, keep everything else as similar as practical, and balance which condition goes first. The factors guide includes a worksheet for this. A small personal experiment can describe your observations without making a claim about everyone.
When a result surprises you, use the troubleshooting guide to check the task, setup and complete set of attempts. Do not infer an intelligence score, diagnosis or driving qualification from the number. The goal is to understand what happened in a specific test and choose a useful next step.
Questions, answered.
What is the average reaction time of a human?
There is no single value across all tasks. One controlled adult simple visual study reported a 231 ms raw mean, but its method differs from a casual online test. Sound, choice, reaching and driving measurements should be considered separately.
Is the average the same as the 50th percentile?
No. The mean is an arithmetic calculation; the 50th percentile is the median. They can differ when the distribution is uneven, as response-time data often are. A percentile also needs a specified reference group.
Can I compare my sound score with a visual average?
That is not a matched comparison. The stimulus and output equipment differ. You can compare your own sound and visual sessions as an exploratory device-specific exercise, but not as a pure measure of sensory processing speed.
Where should I start?
Take the five-round visual test if you need a number. Use the score interpreter if you already have one. Choose the age, gaming, auditory, choice or driving guide when your question is about that particular context.
Sources & methodology
Reviewed September 21, 2026. Research values belong to the task and sample named below. Illustrative examples are labelled; they are not population data.
Adult visual reference; apparatus correction applies only to the studied setup.
An example of context-specific terminology: perception, reaction and braking are separated in the manual.