Start with the sample, not an age label.
Average reaction time by age is meaningful only when the task is named. Clicking after a color change, reaching toward a target and choosing between four keys are different measurements. A table that combines those tasks can look reassuringly precise while answering no single question. Before reading a number, check who was tested, how they responded and whether the result is a mean or a median.
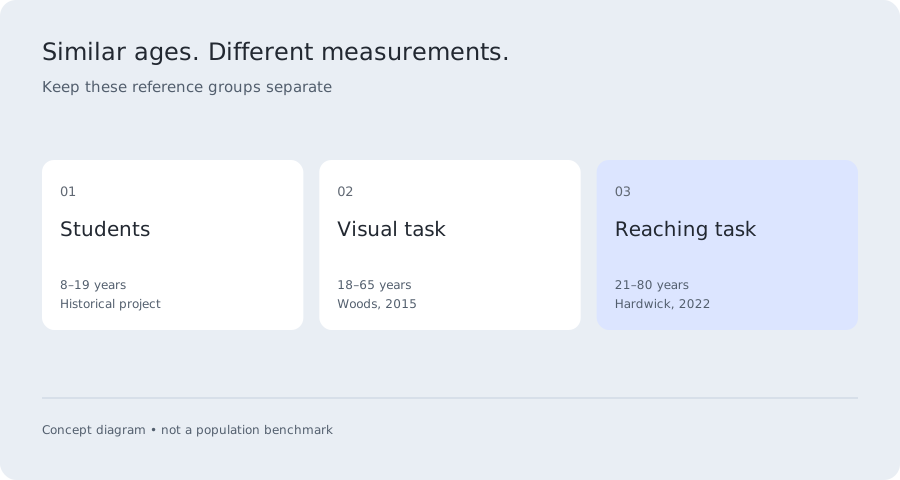
This page separates a historical school dataset from adult research. The student table offers actual published age rows. The adult study gives a sample-wide mean and an age association; it does not give a validated target for every birthday. We do not fill the gaps by inventing a smooth curve or extrapolating an adult study to a twelve-year-old.
If you arrived with your own score, write down the test name, input method and number of attempts first. Your browser score may be useful for personal tracking even when none of the studies here is a close enough match for direct comparison. An honest “not comparable” is a useful result: it prevents a misleading judgment about ability.
Published student values, with the context attached.
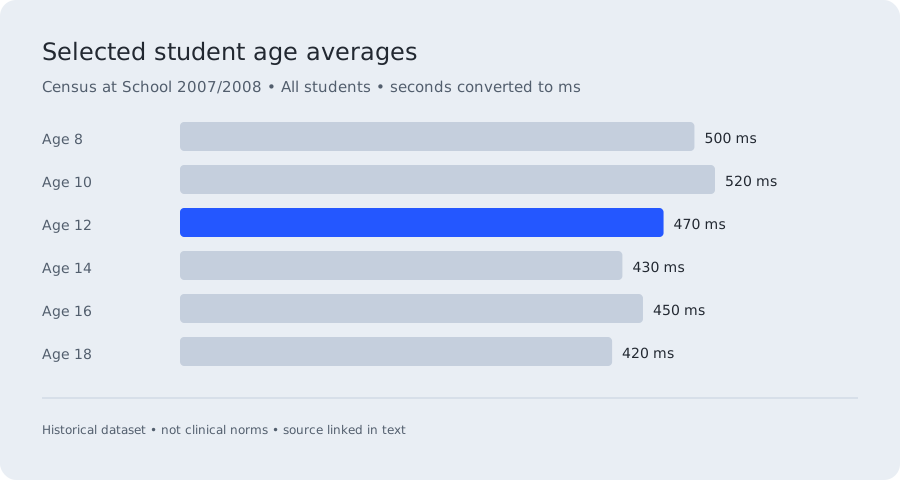
The Census at School 2007/2008 results publish age-specific averages for participating students. The selected rows below use the “All students” column. The source reports seconds; the millisecond column is a unit conversion, multiplying by one thousand. These are historical project results, not a representative clinical reference for all children today.
The summary page does not supply age-row sample counts or a complete apparatus protocol alongside this table. Those gaps limit comparison with our tool. In particular, a teenager should not subtract their current browser score from a row and interpret the difference as a developmental advantage or delay. Average reaction time by age needs more context than an exact-looking number.
For an average reaction time for a 16 year old, this dataset reports 0.45 seconds for that age row. For age 12, it reports 0.47 seconds. These answer a dataset-specific question; they do not define what either child ought to score here. The unsmoothed table also shows that adjacent ages do not follow a perfectly straight progression.
| Age | Published mean, seconds | Converted milliseconds |
|---|---|---|
| 8 | 0.50 | 500 |
| 10 | 0.52 | 520 |
| 12 | 0.47 | 470 |
| 14 | 0.43 | 430 |
| 16 | 0.45 | 450 |
| 18 | 0.42 | 420 |
Adult findings do not create a birthday calculator.
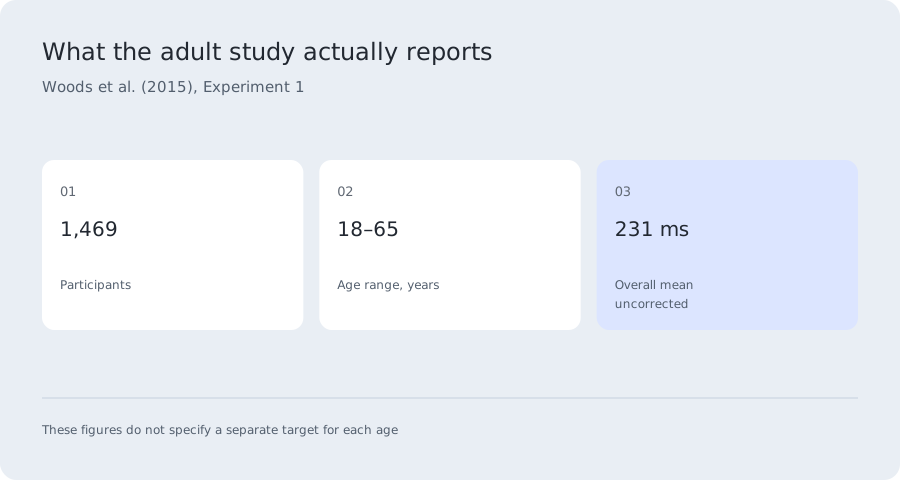
Woods and colleagues studied 1,469 adults aged 18–65 in a controlled simple visual task. Experiment 1 reported an overall mean of 231 ms, or 213 ms after an apparatus-specific correction, and an estimated age association of 0.55 ms per year. Those are properties of the study, not calibration instructions for your computer.
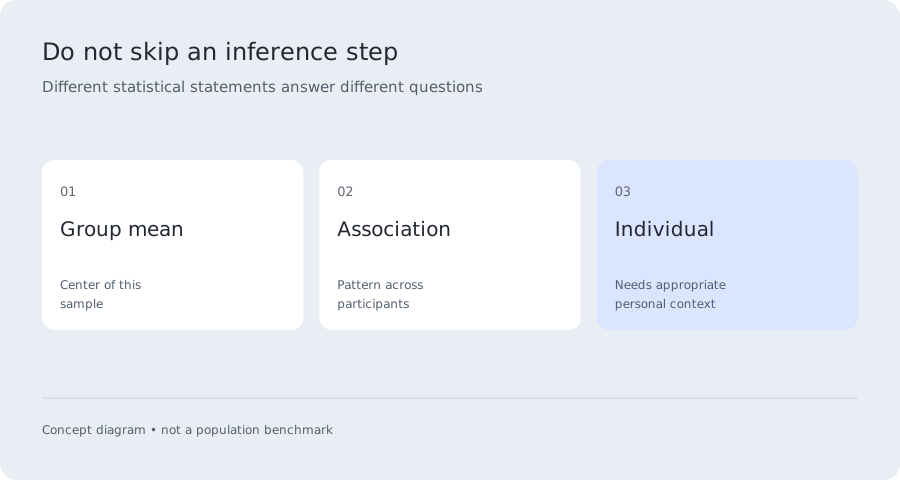
When presenting average reaction time by age, the distinction between an association and a personal forecast matters. A slope estimated across participants does not tell you exactly how much your own performance will change next year. The overall mean is also not the mean at age eighteen. Starting a line at 231 ms at age eighteen would misrepresent the published result.
A separate study of 54 adults aged 21–80 used target-directed reaching and distinguished preparation from movement initiation. Its task is useful for understanding why a response has multiple stages, but its timing should not be inserted into a simple clicking table. The question “at what age does your reaction time slow down?” therefore needs a named outcome and study, not one universal cutoff.
When does reaction time peak?
An exact peak age cannot be established from the two adult datasets summarized here. One starts at eighteen; the reaching study starts at twenty-one. Neither measures the whole lifespan with this website’s method. Average reaction time by age should acknowledge the ages missing from a study before announcing a peak in adolescence or early adulthood.
Even within the same task, people overlap substantially. A group tendency cannot rank two individuals of different ages, and being outside a group mean is not itself abnormal. A mean describes a center, not an allowed range. A reliable age percentile would require the underlying distribution, sufficiently sized age groups and a matching protocol.
For the average reaction time for teenagers, prefer a clearly described student task over a table reverse-engineered from adult estimates. Parents and teachers can use measurements to teach variability and fair comparisons. They should not use a short online game to label a child as delayed, gifted or medically impaired.
A practical way to use your own result.
Take a familiarization session, then record several complete sessions using the same device. Retain the median, average and any interrupted attempts. Note whether you used a mouse, keyboard or touchscreen. If you change the input device, begin a separate record so an equipment change does not masquerade as a change in you.
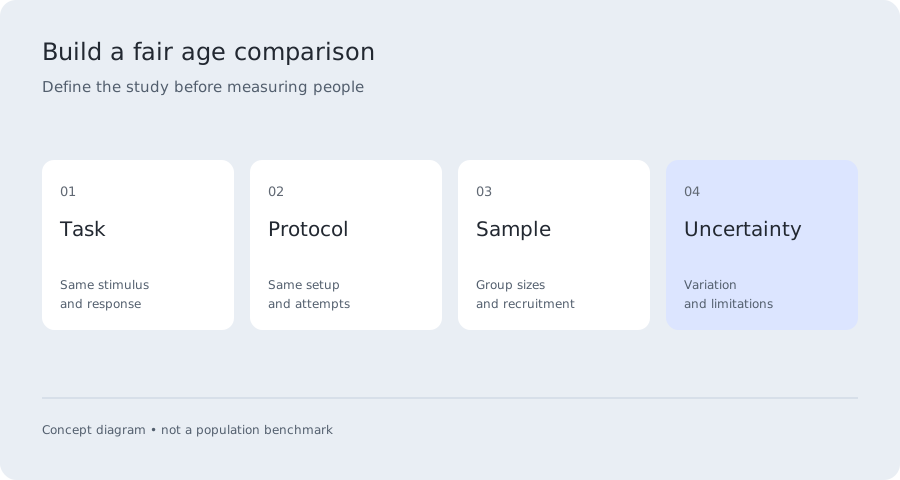
For a class experiment about average reaction time by age, decide the question before collecting data. Use the same task, instructions and number of attempts for each participant. Report how participants were recruited and how many are in each group. Avoid publishing names or comparing children publicly through a leaderboard.
If your question is personal progress rather than population research, a consistent self-comparison is simpler. Compare complete sessions across days, look at variation and explain unusual circumstances. Our age guide supplies context; the score interpreter supplies a conditional reference comparison. Neither replaces an assessment chosen and administered by a qualified professional.
Questions, answered.
Is 200 ms good for my age?
There is no validated age-specific ranking for this website. A repeated 200 ms result can be compared with your own earlier sessions on the same setup. A study mean supplies context only when its task and sample are relevant; it does not yield an age percentile.
Can I use this average reaction time by age table for a school project?
Yes, as a clearly attributed historical dataset example. Cite Census at School, preserve the year and units, and explain the missing protocol and age-row sample sizes. Do not present it as a new survey you conducted or as current population norms.
Why do age tables on different websites disagree?
Some summarize different tasks or populations; others offer indicative ranges rather than directly published age rows. Check whether each exact number maps to a named study table. Agreement in an article headline does not prove that the measurements are interchangeable.
Does an older person always react more slowly?
No. A relationship in group data does not determine every individual comparison. Experience, testing conditions and the task itself still matter. Average reaction time by age is a description with uncertainty, not a rule that ranks people.
Sources & methodology
Reviewed September 21, 2026. Research values belong to the task and sample named below. Illustrative examples are labelled; they are not population data.
Selected All students rows; seconds converted to milliseconds. Age-row counts and full apparatus details are not provided on this summary page.
Experiment 1 adult sample and task-specific findings. Overall mean is not a per-age norm.
54 adults, ages 21–80; a reaching task, distinct from this website’s click test.