Start with the comparison you are making.
Why is my reaction time so slow? A useful first step is to ask “slower than what?” You may be comparing today with a previous session, your phone with a friend’s computer, or a choice task with a simple click test. Those comparisons have different explanations and need different checks. The number alone does not identify a cause.
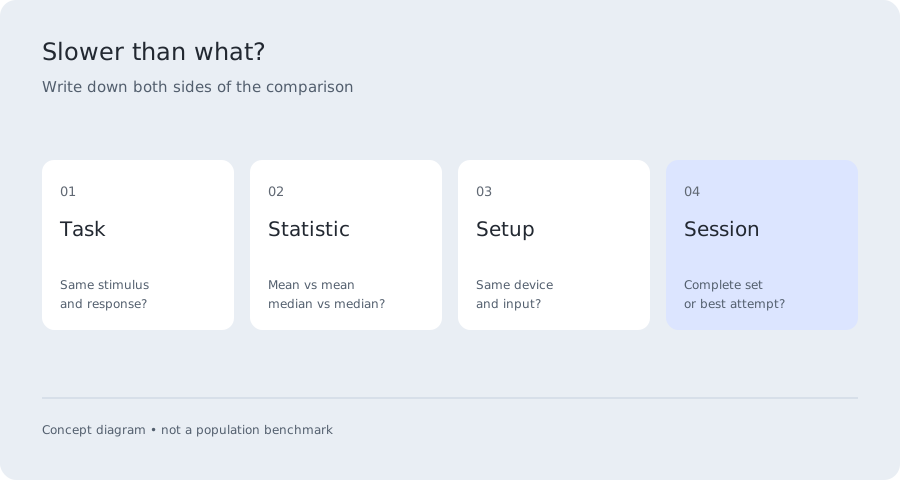
Write down the two things you are comparing. Include the task name, signal, input method, number of trials and reported statistic. If one result is a best attempt and the other is a session mean, compare like statistics before drawing a conclusion. If one task involves moving to a target, it includes work that a prepared click does not.
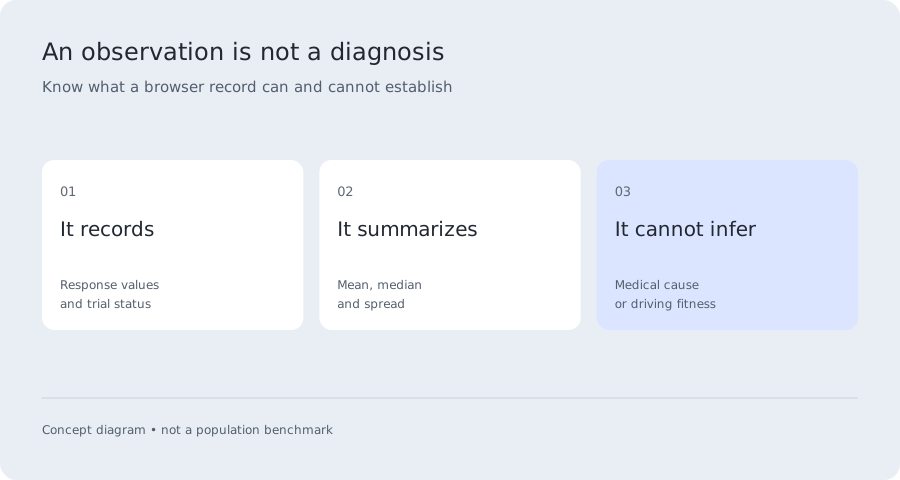
The checker above asks for three to one hundred valid response times and four measurement checks. It calculates a median, mean and range without silently deleting values. Its next-step suggestion follows the first unchecked condition. This is a practical way to organize an investigation, not a diagnostic model or a claim to discover a hidden medical cause.
Inspect the pattern inside the session.
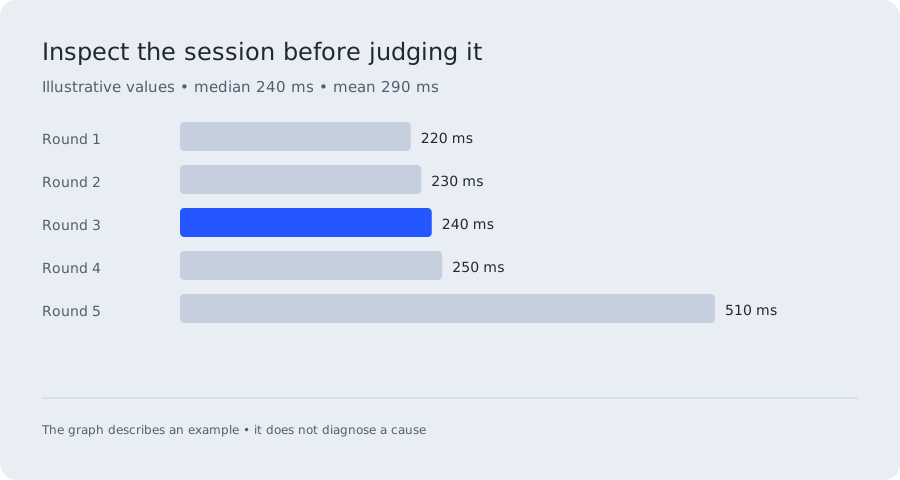
If you are asking “why is my reaction time so slow” after one disappointing result, enter the whole session. An average can be raised by one long response even when the remaining values are close together. The median and range help reveal that pattern, although neither statistic identifies why the long response occurred.
For an illustrative set of 220, 230, 240, 250 and 510 ms, the median is 240 ms, the mean is 290 ms and the range is 290 ms. All five values remain included. If you looked away during the last trial, record that fact. Do not retrospectively delete every slow value simply because removing it produces a better score.
The range is the largest value minus the smallest. It is not a confidence interval or a normality score. With only a few observations it can change substantially between sessions. Keep the original values beside the summaries so you can revisit an interpretation instead of being left with one number and no context.
Check the input and display conditions.
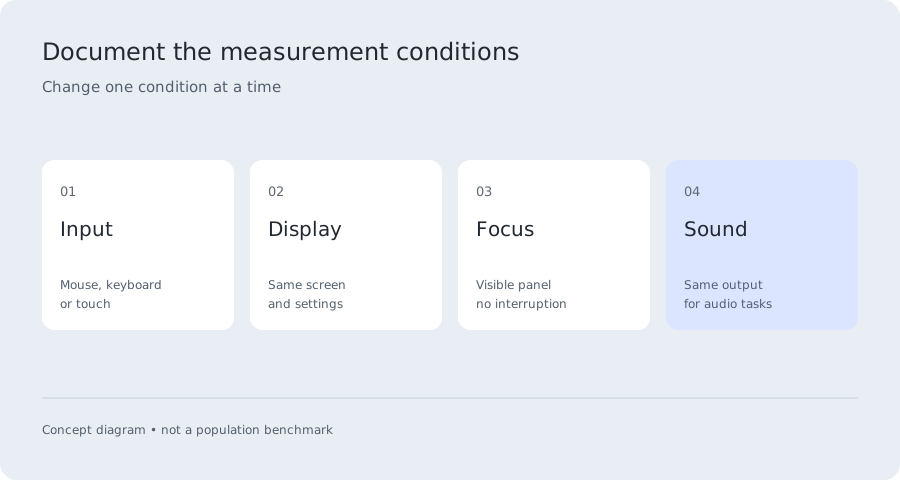
A mouse, trackpad, keyboard and touchscreen do not necessarily deliver the same measured result. Your hand position may change too. Keep the same input throughout a comparison session. If the question is specifically about input devices, record separate conditions and alternate which one you use first.
Check that the signal is fully visible and the page has focus. Close an overlay that covers the test. Note unusually busy software or a display setting change, then repeat a clean session. Do not change five settings at once and attribute an improvement to one of them. The purpose is to make the comparison interpretable, not to optimize a number at any cost.
For sound tests, check the output device and preview. Audio buffering and routing are separate from display timing. A browser cannot subtract all of those delays with a universal correction. The Woods measurement study illustrates why apparatus calibration matters, but its hardware correction cannot be applied directly to your computer.
Retest in a way that answers a question.
Why is my reaction time so slow gaming, even when the click test seems fast? The game may ask you to search, recognize, decide and aim. Use a clearly defined game scenario and record accuracy as well as speed. The gamer guide explains those task differences; repeating a simple test indefinitely will not tell you which part of a game encounter needs attention.
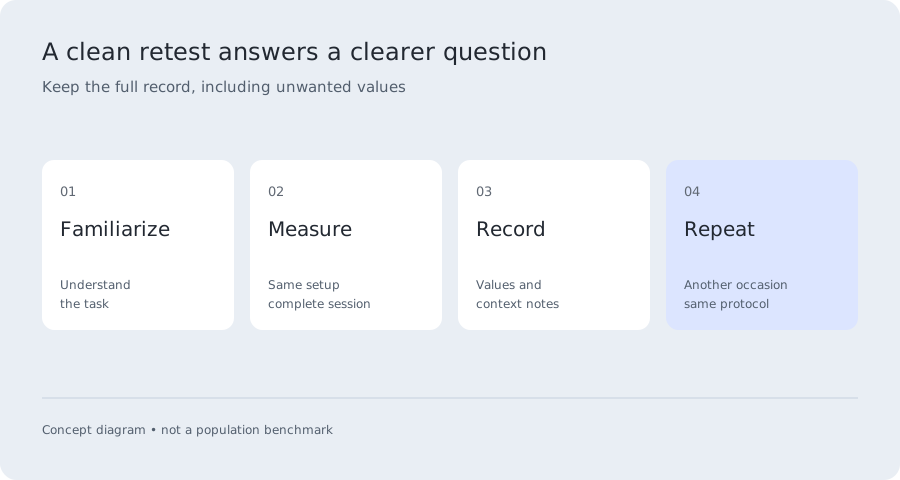
If you want to know whether a session was unusual, repeat the same protocol on another occasion. Start with a familiarization round, keep the same device and retain complete sessions. Write down obvious interruptions and ordinary context. Compare the same summary statistic rather than comparing one session’s best with another’s average.
Fatigue is one relevant context factor: CDC/NIOSH describes slowed responses and effects on attention as possible consequences. A browser result cannot tell you whether fatigue caused your particular score. Do not intentionally lose sleep, use substances or change medication to create a test condition. For a harmless measurement experiment, compare input methods instead.
Separate a disappointing score from a health concern.
Why is my reaction time so slow at a young age? Age alone cannot explain an individual browser result, and the tool has no validated age-specific diagnostic threshold. Check the task and measurement conditions first. Neither a fast score nor a slow one can confirm or rule out a health problem.
If “why is my reaction time so slow all of a sudden” describes a change you notice in everyday functioning, rather than just a different website score, do not rely on repeated online testing for reassurance. New or persistent concerns deserve an appropriate professional assessment. If symptoms are sudden and severe, use urgent local medical help instead of continuing this exercise.
Download the checker record if it helps you keep track of what you measured. It contains your entered values, descriptive summaries and checked conditions. It does not identify a disease, certify fitness for driving or recommend treatment. You can also use the factors guide to understand experimental influences without interpreting them as a personal diagnosis.
Questions, answered.
Why is my reaction time so slow compared with my friend’s?
First check the task, device, input and statistic. A phone average and a desktop personal best are not matched observations. Even under similar conditions, individual variation remains. The difference does not automatically mean a problem or identify one cause.
Should I remove an unusually slow trial?
Keep it in the raw record. Apply any exclusion rule consistently and decide the rule in advance. If a trial was interrupted, label it; do not remove valid responses merely to lower the mean. The checker includes all supplied values.
Can the checker detect outliers?
It shows the mean, median, range and endpoints so you can inspect variation. It does not apply a statistical outlier test, automatically remove a value or infer the cause of a long response. With short sessions, those claims would be especially fragile.
Will a faster mouse fix the problem?
This tool cannot promise that. A device change can alter measurement conditions, but so can posture, display timing and familiarity. Compare complete sessions under a controlled setup rather than assuming a purchase will produce a fixed improvement.
Why do my results change from one attempt to the next?
A response is not perfectly constant, and the measurement chain can vary too. Keep multiple attempts and context. A single score is a snapshot, while repeated complete sessions show more of the pattern.
Sources & methodology
Reviewed September 21, 2026. Research values belong to the task and sample named below. Illustrative examples are labelled; they are not population data.
Fatigue can affect response speed and attention. This general evidence cannot diagnose a particular browser result.
Apparatus calibration and protocol affect interpretation. No study correction is applied to user-entered values.