“Good” depends on the task you completed.
What is a good reaction time? For a simple visual task, a shorter, repeatable response is faster. Whether it is good for a particular purpose depends on the reference and the outcome you care about. A person who clicks quickly after a color change has not necessarily demonstrated fast driving decisions, accurate target selection or strong performance in a competitive game.
The interpreter starts with your score, test type and input method. For simple visual results it gives the numerical difference from one named adult study mean. For sound, choice or unidentified tasks it explains why that visual reference is unsuitable. It does not use the same colored grading bands for fundamentally different activities.
The practical answer to “what is considered a good reaction time” is therefore conditional: a result that is consistently quicker under the same protocol is an improvement in that measured task. A comparison with another population needs additional evidence. We show those conditions beside the output rather than hiding them behind a confident grade.
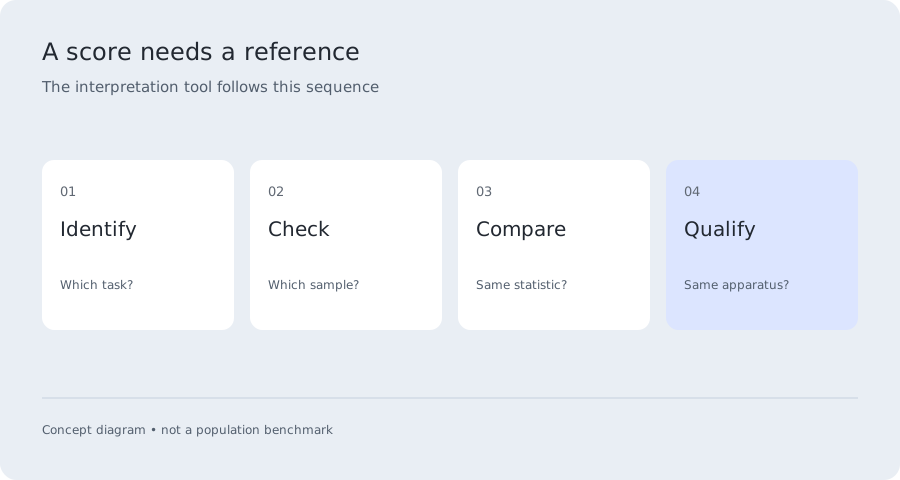
One explicit reference, not a universal grading scale.
Woods et al. reported an uncorrected mean of 231 ms for 1,469 adults aged 18–65 performing their simple visual task. The interpreter uses that published mean as a context point. It does not subtract their hardware correction from your result, estimate an age-adjusted score or assume your equipment matches the laboratory apparatus.
For example, 200 ms is numerically 31 ms shorter than 231 ms. That arithmetic is correct even when the measurements are not directly comparable. It does not prove that 200 ms beats a particular percentage of people. A percentile needs an appropriate distribution, not just a mean and a smaller number.
What is a good reaction time in ms when you are on a phone? The same question about measurement applies. The touchscreen, display and response posture differ from a desktop mouse setup. The interpreter retains your selected input method and highlights the mismatch rather than inventing a universal mobile adjustment.
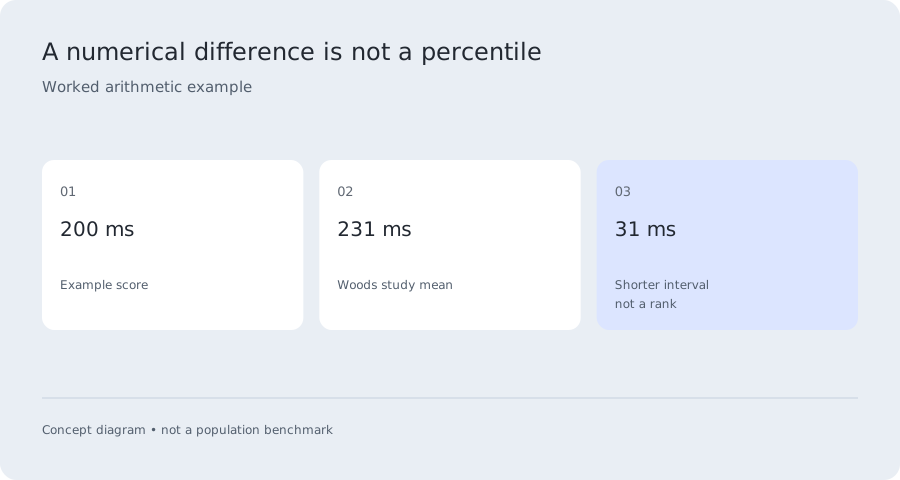
Use a complete session, not the most exciting click.
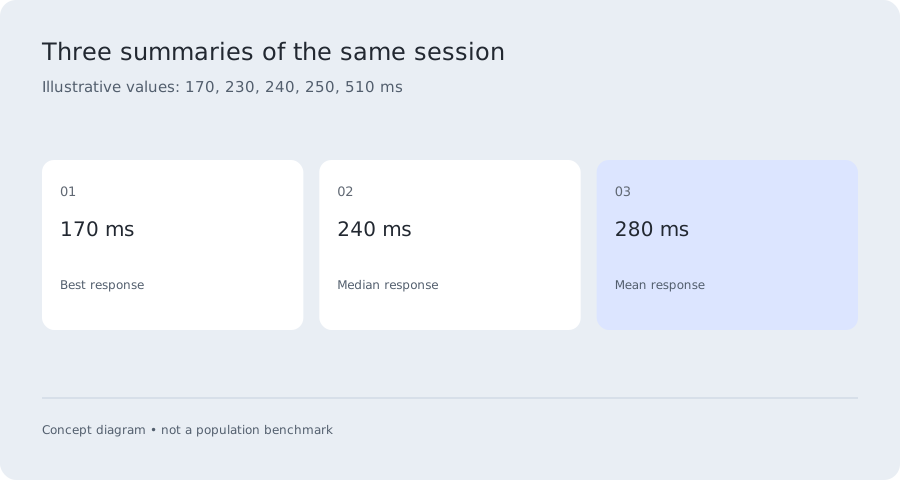
One response can be affected by anticipation, distraction or an input mistake. Complete a session and preserve all attempts, including the ones you dislike. Use the median to describe the middle response and the mean to see the influence of unusually long observations. Keep the number of trials with both statistics.
Consider an illustrative session of 170, 230, 240, 250 and 510 ms. The best is 170 ms, the median is 240 ms and the average is 280 ms. Each statement is true, but quoting only the best changes the impression dramatically. If a friend quotes an average, comparing your minimum to it is not fair.
For a personal baseline, take a familiarization session and then record several complete sessions under the same conditions. Record the task name, device, input and date. Choose that method before checking the result. Restarting until a desired score appears changes the selection process and makes the final number less representative.
How to think about 170, 180, 200 and 300 ms.
If you ask “is 170 ms reaction time good” or “is 180 ms reaction time good,” both are shorter than the visual study mean used here. Repeat the task without predicting the signal and examine the whole session. A fast individual response cannot establish exceptional biological ability, especially across different hardware.
For “is 200 ms reaction time good,” the same conditions apply. A repeatable 200 ms session on a clearly described visual task is more informative than a single 200 ms trial selected from many attempts. If you ask whether 300 milliseconds is good, a longer numerical comparison is not evidence that something is medically wrong.
What is a good reaction time for a choice task? You must also report the number of options, the mapping, the trial count and accuracy. Someone who guesses quickly and gets half the answers wrong should not be ranked above someone who answers every trial correctly. Read speed and accuracy together.
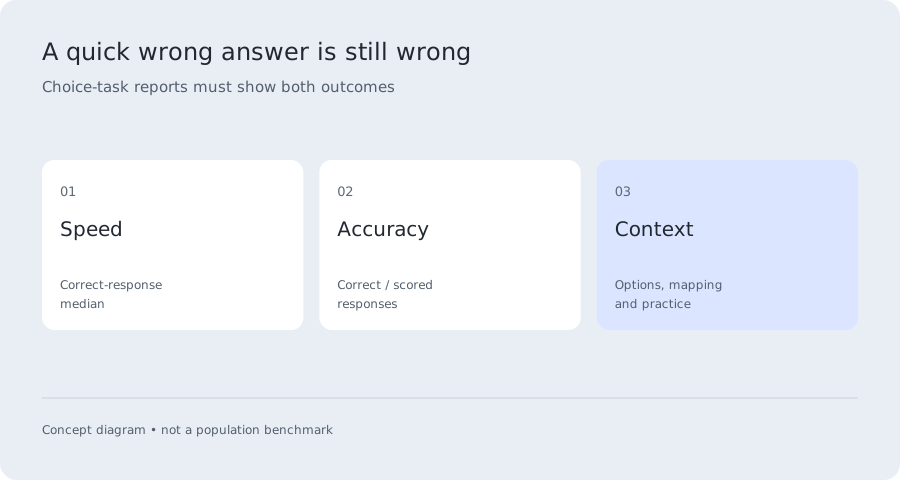
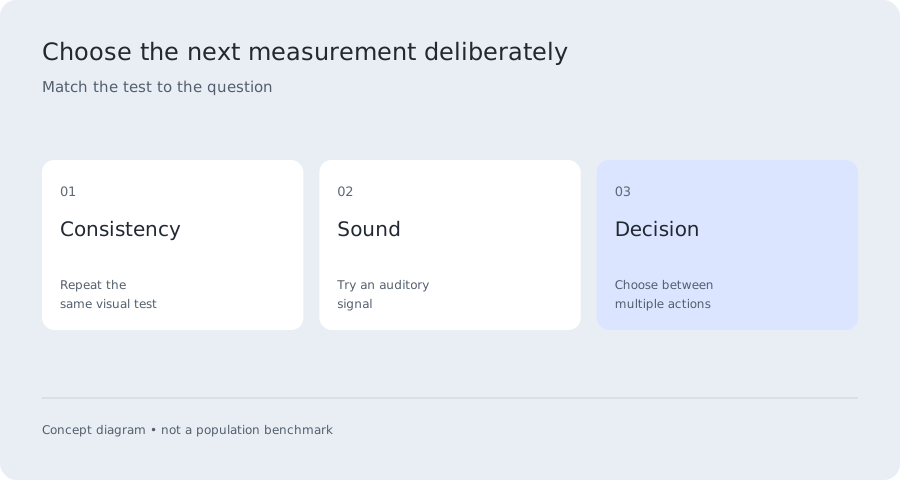
Decide what you want the next test to answer.
If the question is consistency, repeat the same visual test on the same setup. If the question is how you respond to sound, take the auditory version and keep its records separate. If the question is choosing an action, use the choice task after learning its mapping. Selecting the right task makes the result more useful than adding extra decimal places.
What is a good reaction time for gaming or driving cannot be decided by this interpreter. A game includes target identification, aiming and decisions; driving includes hazard recognition and other stages before braking. The dedicated guides explain those differences. Do not treat a short browser result as permission to drive, operate machinery or ignore a new difficulty in everyday life.
If your score changes, check whether the task or equipment changed first. Compare complete sessions, inspect individual attempts and note interruptions. If a persistent concern extends beyond this test into daily activities, seek appropriate professional advice. The website can describe its measurement and reference, but it cannot assess your health.
Questions, answered.
What is a good reaction time for most people?
There is no single defensible cutoff across all people and tests. This page compares simple visual scores with a named adult study and explains the method mismatch. It does not publish universal good, bad or elite categories without a matching dataset.
Why do you not show my percentile?
We do not have a representative distribution collected with this exact protocol. A mean alone cannot reveal the percentage of people faster or slower than you. Copying a percentile table from another test would create false precision.
Can a very low score be a guess?
Yes. An early guess that lands after the signal can look like a valid fast response. Our test excludes inputs before the signal but cannot read intention. Repeat without anticipating the timing and examine a full session.
Can I compare my median with a study mean?
You can discuss them as different summary statistics, but they are not equivalent. The interpreter explicitly names the research mean. For a closer methodological comparison, use the same statistic and protocol, while retaining equipment and sample limitations.
Sources & methodology
Reviewed September 21, 2026. Research values belong to the task and sample named below. Illustrative examples are labelled; they are not population data.
The 231 ms reference is the Experiment 1 uncorrected group mean. No reference percentiles are calculated here.