Separate perception, response and braking.
Average driver reaction time is ambiguous unless the start and end of the interval are specified. Does it begin when a hazard becomes visible, when a driver recognizes it or when a response is already expected? Does it end when a foot starts moving or when the brake is applied? Those definitions can produce different values without either measurement being wrong.
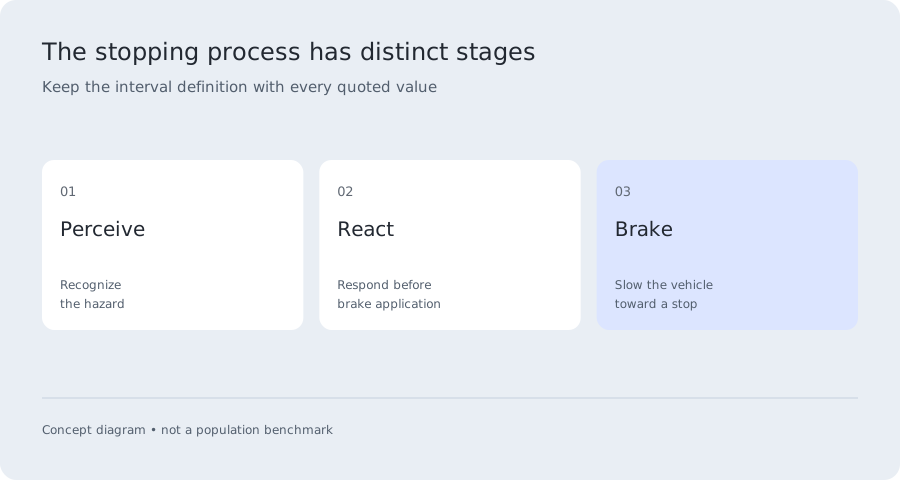
The Georgia Department of Driver Services separates stopping distance into perception, reaction and braking components. In its educational description, perception concerns recognizing the hazard, reaction concerns responding before physically applying the brake, and braking concerns the distance travelled while slowing. Keep those stages separate when reading a benchmark.
Our calculator demonstrates distance travelled at a constant speed during an interval you supply. It does not measure your response, simulate tires or road friction, or estimate a complete emergency stop. You can use it to understand units and assumptions without treating a browser test score as a measure of driving fitness.
Average driver reaction time in official guidance.
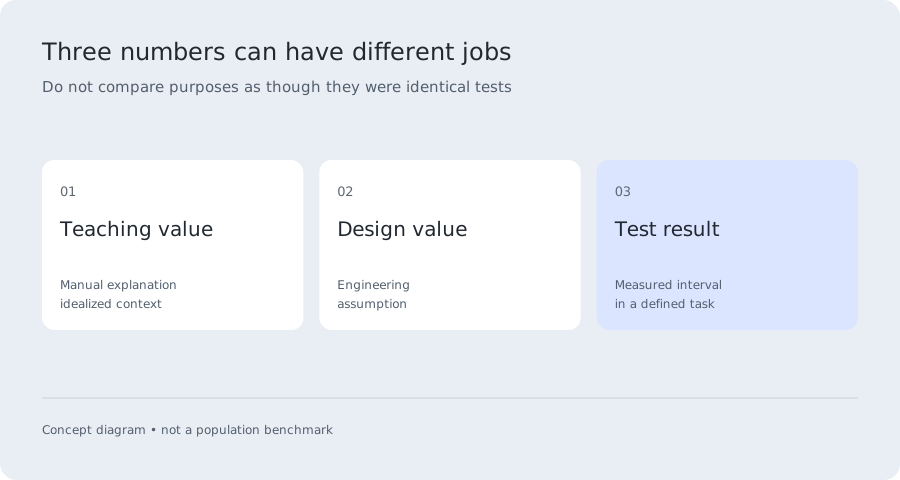
Georgia DDS describes an average reaction interval of three-quarters of a second to one second for an idealized driver response, while separately describing an alert-driver perception interval of one and three-quarter seconds. Those numbers appear in a teaching explanation of stopping distance. They are not the result of this website’s visual test and not a promised response in every hazard.
Average driver reaction time should also be distinguished from a road-design assumption. The FHWA engineering guide discusses stopping sight distance and the perception-response interval used in roadway analysis. A design value is chosen for an engineering purpose, not to give every individual driver a personal grade.
When another article quotes one number, look for the interval definition, conditions and original source. A laboratory pedal task, a known signal and an unexpected real-world hazard are not equivalent. Do not average values from those settings into a new figure and call it the average reaction time for drivers.
| Quantity | Context | Do not interpret it as |
|---|---|---|
| 0.75–1.0 seconds | Georgia DDS idealized reaction component | Total perception-plus-reaction time in every situation |
| 1.75 seconds | Georgia DDS alert-driver perception description | A universal measured value for every hazard |
| Your chosen calculator interval | An explicit assumption for a distance demonstration | A measured driving ability or stopping-distance prediction |
Using average driver reaction time in a calculation.
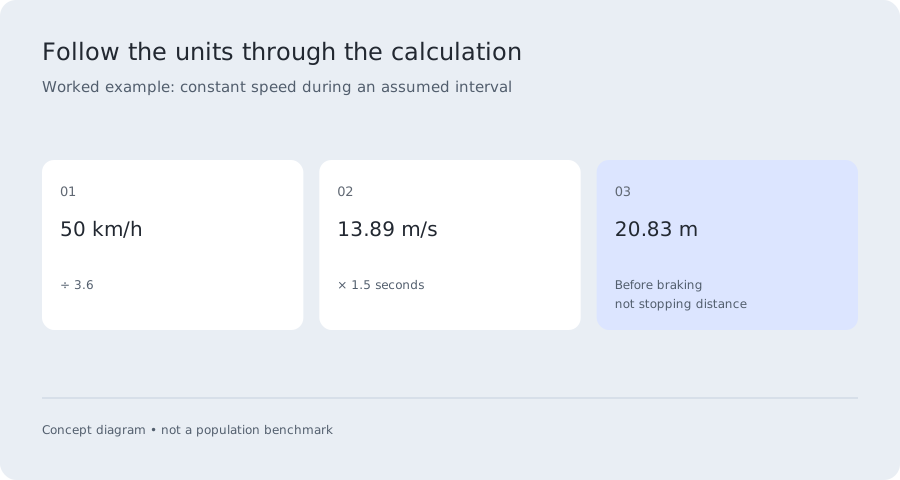
The formula is distance equals speed multiplied by time. Speed must be in metres per second if you want metres. Divide kilometres per hour by 3.6, or multiply miles per hour by 0.44704. Then multiply by the assumed interval in seconds. The calculator shows the substituted formula beside the result so you can verify the calculation.
For example, 50 km/h is approximately 13.89 metres per second. During an assumed 1.5-second interval, a vehicle maintaining that speed travels approximately 20.83 metres. The displayed result rounds to 20.8 metres. This is a worked example, not a measured average driver reaction time and not the distance needed to stop.
At 30 mph with an assumed one-second interval, the same formula gives 13.4112 metres, or 44 feet. Switching units changes the conversion, not the physical principle. The calculator accepts zero speed or zero interval as mathematical edge cases and returns zero distance; neither represents a recommendation for real driving.
What changes the demonstration—and what it leaves out.
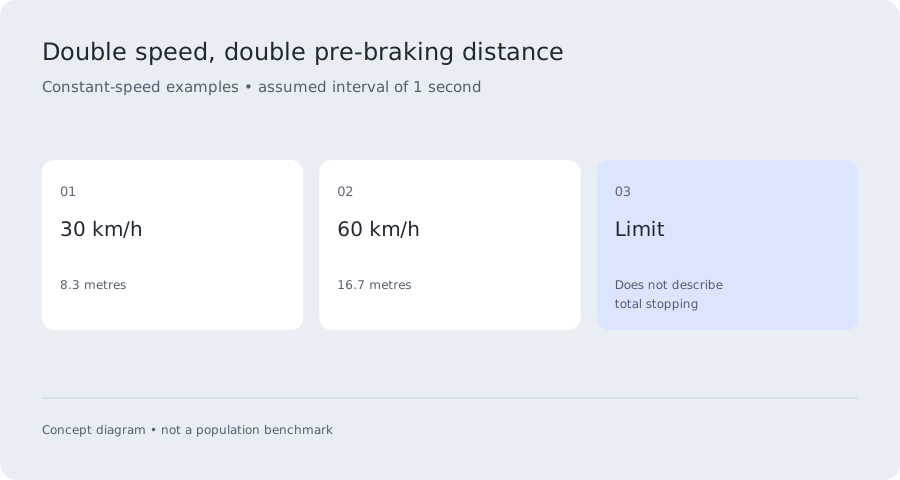
At a fixed assumed time, doubling the speed doubles the distance travelled during that interval. At a fixed speed, doubling the assumed time also doubles that distance. This linear relationship applies to the pre-braking distance in this simplified calculation. It should not be extended to the entire stopping process.
Braking distance depends on additional conditions, including the braking process and available traction. The calculator contains no vehicle model, road grade, tire data or deceleration input. It therefore cannot produce a safe following distance or determine whether a collision would have been avoided in a real event.
Average driver reaction time is only one piece of a much larger safety question. A hazard may be partly hidden, unexpected or difficult to interpret. Fatigue can also affect attention and responses, as CDC/NIOSH explains. A quick browser result cannot establish that someone is alert or fit to drive in the conditions they face.
Average driver reaction time cannot certify safe driving.
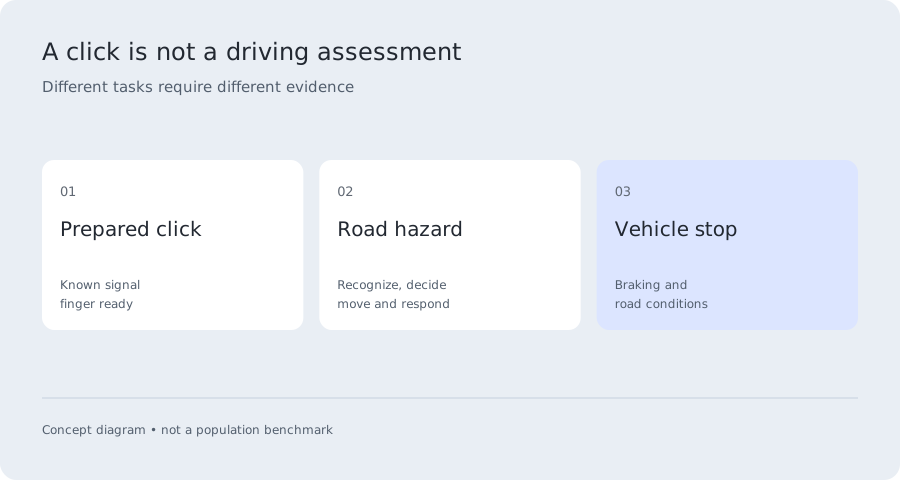
In our visual tool you know that a signal will appear, where it will appear and which response to make. Your finger can be ready on a button. A road hazard involves a wider scene, interpretation, decisions and a different physical response. Replacing an assumed driving interval with a fast browser minimum discards those differences.
If you searched for average braking reaction time or average perception reaction time, return to the exact definition in the source. “Braking” can refer to a response before braking begins or to the subsequent slowing phase, depending on the discussion. Ask which event starts the timer and which event stops it before comparing values.
Use this page while stationary as an educational explanation. For practical road behavior, follow current official guidance for your jurisdiction and situation. If you have concerns about driving ability, seek an appropriate assessment. This tool offers transparent arithmetic and terminology; it does not issue clearance, legal conclusions or individualized safety thresholds.
Questions, answered.
What is the average driver reaction time?
A useful answer must specify the interval. Georgia DDS uses 0.75–1.0 seconds for an idealized reaction component and describes perception separately. Neither value should be treated as a universal response to every hazard or as a personal test result.
Does the calculator show total stopping distance?
No. It shows constant-speed travel during your assumed interval only. It excludes braking distance, vehicle dynamics, road conditions and other necessary inputs. The page labels that limitation beside the result.
Can I enter my 200 ms browser score as a driving time?
The arithmetic will accept 0.2 seconds, but the interpretation would be inappropriate. A prepared finger click does not include the demands of recognizing and responding to a road hazard. Use the interval as a stated assumption, not as driving clearance.
Why do some sources give a longer reaction interval?
They may include perception and decision time, use an unexpected hazard or choose an engineering design assumption. Check the definition and purpose rather than assuming all sources measured the same event.
Does the average driver reaction time tell me a safe following gap?
No. A safe gap depends on official guidance and the driving situation, including factors this calculator does not model. This page does not convert a measured click or an assumed interval into a following-distance recommendation.
Sources & methodology
Reviewed September 21, 2026. Research values belong to the task and sample named below. Illustrative examples are labelled; they are not population data.
Official explanation of perception, reaction and braking-distance components. Values retain the manual’s idealized context.
Roadway engineering context for speed and stopping sight distance; design assumptions are not personal assessments.
Fatigue and driving performance. A browser score cannot certify alertness.